

Best overall for network-focused monitoring: PRTG. Best for self-managed monitoring: Zabbix. Best for network-device discovery: LibreNMS. Datadog is the strongest fit here for connecting network investigation with cloud and application telemetry; Checkmk fits teams monitoring servers and network devices together. This 2026 guide ranks each option by the work your internal IT team needs to do, not by the longest feature list.
- PRTG leads this best network monitoring tools shortlist for growing companies with network-first monitoring needs.
- Zabbix fits teams prepared to administer their own monitoring platform; LibreNMS fits network-device discovery and inventory.
- Datadog fits cloud and application investigation; Checkmk fits mixed server and network monitoring.
- IT Core provides senior technology leadership and flexible IT support that strengthens internal teams.
Why this matters
A monitoring platform should help your team answer a business question: what stopped working, who is affected, and who needs to respond? A dashboard full of device status does not answer all three. You need coverage, useful alerts, and an assigned response process.
For growing companies, choosing the best network monitoring tools in 2026 starts with the operating model. Decide whether your team will administer the platform, manage alerts, and investigate incidents itself or needs outside support. IT Core provides senior technology leadership and IT delivery that strengthens internal teams across co-managed IT, security, cloud, and software development.
IT Core is best for growing companies that need senior technology leadership alongside their internal IT team. That is a service decision, separate from the monitoring software decision. Keep the distinction clear: a tool observes conditions; people decide what to fix and how urgently.
What makes the best network monitoring tools
Use these criteria before comparing product names. The ranking below gives each tool a distinct job rather than treating every platform as interchangeable.
- Network coverage: Confirm support for your actual switches, routers, firewalls, wireless equipment, and remote sites.
- Useful alerts: Check whether alerts identify the affected service, include useful context, and reach an accountable responder.
- Administrative effort: Evaluate installation, updates, credentials, discovery, and the work required to keep monitoring accurate.
- Investigation depth: Decide whether you need device status, traffic analysis, application context, or a combination.
- Team fit: Match the platform to the skills and capacity of the people who will operate it.
- Expansion path: Check how monitoring scope and administration change when you add locations, devices, and services.
A strong result against one criterion does not cancel a weak result elsewhere. Extensive monitoring coverage is little help when nobody maintains the configuration. Equally, a simple setup is not enough if the platform cannot observe the systems your business depends on.
Network monitoring tools at a glance
These 2026 recommendations distinguish network-device monitoring from broader infrastructure and application observability. Product documentation establishes capabilities; the use-case ranking below applies those capabilities to growing-company needs.
| Tool | Best for | Standout capability | Key limitation |
|---|---|---|---|
| PRTG | Network-first IT teams | Sensor-based monitoring across network devices and services | Sensor selection and organization need ongoing attention |
| Zabbix | Teams owning a self-managed platform | Templates, discovery, and configurable alerting | Your team owns platform administration and tuning |
| LibreNMS | Network-device discovery and inventory | Automatic discovery and SNMP-based device monitoring | Application investigation requires additional coverage |
| Datadog | Cloud and application-connected investigation | Network telemetry alongside infrastructure and application monitoring | Device monitoring and traffic investigation require distinct coverage decisions |
| Checkmk | Mixed server and network estates | Service discovery across servers and network devices | Discovery results still need operational review |
1. PRTG: best network monitoring tool for network-first teams
PRTG monitors devices and services through sensors that represent individual checks. That makes it a practical starting point when your main questions concern device availability, interface behavior, and service health. Paessler's PRTG documentation describes its sensor model and supported monitoring methods.
PRTG wins the default recommendation when network operations are the main task. Start by mapping important services to their supporting devices. Then select checks that tell your team whether those services are working, rather than enabling every available measurement.
PRTG pros:
- Device and service monitoring fit within the same platform.
- The sensor model makes individual monitoring checks explicit.
- Network-focused checks support investigation of device and interface conditions.
PRTG cons:
- Sensor selection becomes another configuration task as coverage expands.
- More measurements do not automatically produce better alerts; your team must organize and tune them.
Best for: An internal IT team whose first priority is understanding network availability and performance across company locations.
For a PRTG evaluation, test a lost connection, an unavailable service, and a device maintenance event. Confirm that alerts distinguish an actual service interruption from planned work. The pilot should demonstrate a usable response process, not just successful discovery.
Verdict: Buy PRTG when your primary need is network-focused monitoring and your team can own the alert configuration.
2. Zabbix: best network monitoring tool for self-managed control
Zabbix is an open-source monitoring platform for networks, servers, and applications. Its documentation covers templates, discovery, triggers, and notification actions. Those building blocks give an experienced team substantial control over what is collected and when an alert is raised.
The deciding factor is operational ownership. Zabbix fits a company that wants to administer its monitoring environment and has people available to maintain it. Treat that work as part of the selection, not as something to resolve after installation.
Zabbix pros:
- Templates provide reusable monitoring configurations.
- Discovery supports adding monitored systems without configuring every check individually.
- Triggers and actions let teams define their own alert logic and notifications.
Zabbix cons:
- Your team must administer the monitoring platform and its supporting components.
- Flexible configuration creates ongoing work around templates, thresholds, and exceptions.
Best for: An experienced internal team that wants direct control over a self-managed monitoring platform.
During evaluation, ask the intended platform owner to update a template, investigate a failed collection, and modify an alert. Those tasks reveal whether the team can maintain the system after the initial project ends. A successful installation alone does not establish operational fit.
Verdict: Buy into Zabbix when self-managed control is a deliberate requirement; skip it when nobody can own platform administration.
3. LibreNMS: best network monitoring tool for device discovery
LibreNMS focuses on network monitoring with automatic discovery and support for SNMP-based collection. Its documentation covers device discovery, alerting, and network-device support. It belongs on your shortlist when the immediate problem is knowing what network equipment exists and how it is behaving.
That focus is useful, but it has boundaries. A healthy switch interface does not prove that a business application works. Keep device visibility and application availability as separate requirements in your evaluation.
LibreNMS pros:
- Automatic discovery supports building network-device visibility.
- SNMP collection supports monitoring device and interface measurements.
- Network inventory and alerting address practical network administration needs.
LibreNMS cons:
- Application investigation needs checks or tools beyond network-device measurements.
- Discovery depends on correct access, credentials, and reachable management interfaces.
Best for: A network team that needs a clearer equipment inventory and ongoing device-level monitoring.
For a LibreNMS pilot, compare the discovered equipment against your known device list. Investigate omissions before adding more locations. Discovery is only useful when the team understands what is missing, why it is missing, and whether that gap affects an important service.
Verdict: Buy into LibreNMS for network-device visibility; skip it as the sole answer to application troubleshooting.
4. Datadog: best network monitoring tool for cloud context
Datadog combines infrastructure monitoring with application and network monitoring capabilities. Its documentation distinguishes Network Device Monitoring from Cloud Network Monitoring. That distinction matters: observing a router and investigating traffic between workloads are different monitoring jobs.
Datadog earns this slot when network questions arrive during application or cloud investigations. Your team needs to relate network behavior to the systems serving users, rather than stop at equipment health. Define the required telemetry before deciding which capabilities belong in your scope.
Datadog pros:
- Network investigation can sit alongside infrastructure and application monitoring.
- Device monitoring and workload traffic monitoring address different visibility needs.
- A broader observability environment gives teams additional context for incident investigation.
Datadog cons:
- You must distinguish device coverage from workload traffic coverage during planning.
- Broader telemetry requires collection configuration and clear ownership across teams.
Best for: Companies whose IT and development teams investigate connected cloud, application, and network problems.
Evaluate Datadog against a real troubleshooting question, such as whether a service interruption originates in an application or its network dependencies. Confirm that the necessary systems contribute telemetry. An isolated network dashboard does not demonstrate the value of connected investigation.
Verdict: Buy Datadog when application and cloud context are central to network troubleshooting; hold when device health is the only requirement.
5. Checkmk: best network monitoring tool for mixed infrastructure
Checkmk monitors servers, network devices, and other infrastructure through service discovery and monitoring integrations. Its documentation describes agent-based monitoring, SNMP monitoring, and discovered services. It fits a team that wants to review a mixed infrastructure estate through a shared monitoring process.
The practical advantage is scope across different system types. The practical responsibility is deciding which discovered services matter. Your team still needs thresholds, maintenance handling, and an owner for each actionable alert.
Checkmk pros:
- Server and network-device monitoring share an infrastructure monitoring environment.
- Service discovery helps identify available monitoring checks.
- Monitoring rules support consistent configuration across groups of systems.
Checkmk cons:
- Discovered services need review before they become useful operational coverage.
- Broad infrastructure visibility does not replace dedicated application tracing when that is required.
Best for: Internal IT teams responsible for both server health and network-device operations.
Test Checkmk with systems from different parts of your estate, not just one well-understood server. Review the discovered checks with the people responsible for each system. That exercise exposes unclear ownership and irrelevant alerts before the platform becomes part of daily operations.
Verdict: Buy Checkmk when mixed infrastructure monitoring is the priority; hold when your primary requirement is application-level investigation.
How the ranking works
This 2026 ranking applies the same criteria to every option: coverage, alert usefulness, administration, investigation depth, team fit, and expansion. It is a capability-based buying guide, not a claim of hands-on testing or measured product performance.
PRTG takes the default network-first position. Zabbix, LibreNMS, Datadog, and Checkmk take distinct positions because each addresses a different operating requirement. Your best choice changes when your main task changes; the order is not a universal quality score.
Turn the shortlist into a practical pilot
Use a 30-day pilot as a planning window, not a promised implementation timeline. Select 3 business services whose interruption would create meaningful work for your team. Assign 2 named owners: one responsible for the monitoring platform and one responsible for coordinating responses.
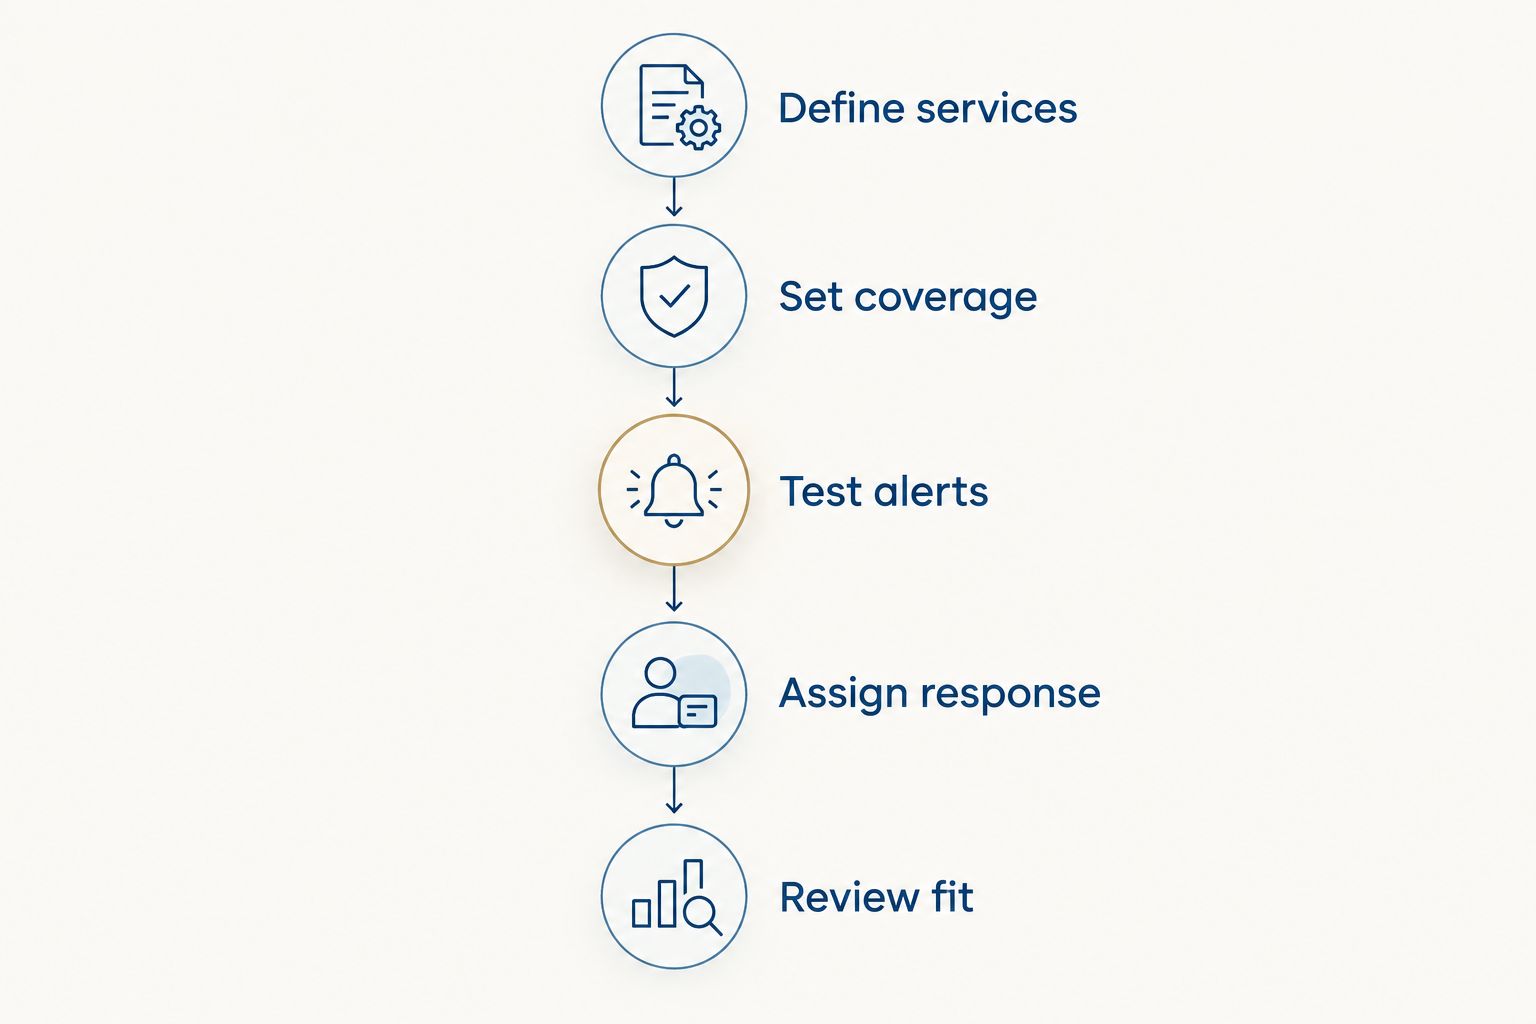
Follow this sequence before extending coverage across the company:
- Define services: Identify the users, systems, and network connections supporting each selected service.
- Set coverage: Choose measurements that reveal availability and help explain a failure.
- Test alerts: Create controlled test conditions during approved windows and inspect the resulting notifications.
- Assign response: Record who investigates, who escalates, and how planned maintenance is handled.
- Review fit: Assess useful coverage, unnecessary alerts, administrative work, and unresolved gaps.
The sequence matters. Starting with discovery encourages you to monitor whatever the tool finds; starting with services helps you monitor what the business needs. Keep the pilot narrow enough that your team can inspect every important alert.
At the end of the pilot, document one decision: adopt, extend the evaluation, or reject. Explain that decision using the original criteria. Do not accept a monitoring platform simply because the team has already spent time configuring it.
IT Core can strengthen internal teams through senior technology leadership and IT delivery. Keep the service discussion focused on responsibilities: which decisions stay with your team, where outside support is needed, and who remains accountable for responding.
Define your monitoring responsibilities
Discuss senior technology leadership and flexible support for your internal IT team.
Which network monitoring tool should you choose?
Choose PRTG as the default in 2026 when your main requirement is network-device and service monitoring. Choose Zabbix for a deliberately self-managed platform, LibreNMS for network-device discovery, Datadog for cloud and application-connected investigation, or Checkmk for mixed server and network operations.
If you remain undecided, write down the incident your team struggles to explain today. Use that incident as the pilot scenario. The right platform should provide the evidence your responders need without creating an administration burden they cannot sustain.
FAQ
What's the best network monitoring tool for a growing company in 2026?
PRTG is the default recommendation for a growing company with network-focused monitoring needs. Choose a different tool when self-managed control, device discovery, cloud context, or mixed infrastructure coverage is the main requirement.
Is Zabbix better than PRTG?
Zabbix is the better fit when your team deliberately wants to own and administer a self-managed monitoring platform. PRTG is the default recommendation here for network-first teams; compare both against your actual devices and response process.
Can LibreNMS replace application monitoring?
LibreNMS should not be your sole answer to application troubleshooting. Network-device measurements show equipment conditions, but you still need checks that establish whether the business application works.
When should a company choose Datadog for network monitoring?
Choose Datadog when network investigation needs cloud, infrastructure, and application context. Separate network-device requirements from workload traffic requirements before defining your monitoring scope.
Is Checkmk suitable for servers and network devices?
Checkmk supports monitoring across servers and network devices. It fits teams managing a mixed infrastructure estate, provided they review discovered services and assign alert ownership.
Does network monitoring replace security monitoring?
Network monitoring does not replace a security monitoring program. Availability and performance checks answer different questions from security detection, investigation, and response, even when some telemetry overlaps.
Should an internal IT team manage monitoring alone?
An internal IT team should manage monitoring alone only when it can own platform maintenance, alert configuration, and incident response. IT Core offers senior technology leadership and flexible IT support that strengthens internal teams when additional support is needed.
One last thing
Before choosing a platform in 2026, ask who will act when an alert arrives during planned maintenance. That question tests more than notification delivery: it exposes whether your team has agreed on maintenance handling, escalation, and ownership.
An alert without an owner is an unresolved operating decision. Set that responsibility before expanding coverage. Better monitoring starts with a clear response, not a larger dashboard.